Examples
Included below are a few examples of how to run ebtel++ and plot the results using Python. The results files can be parsed very easily by any language (e.g. IDL,Matlab). Configuration files can also be easily manipulated by hand, but in practice, particularly when computing many EBTEL runs, it is better to script this. The util.py script provides several convenient utilities for manipulating these configuration files.
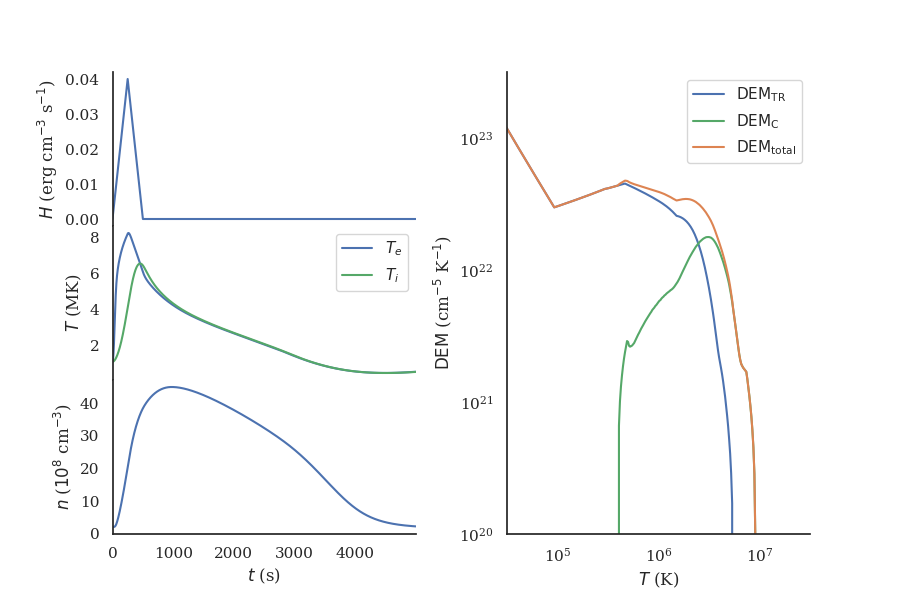
Electron Heating
In this example, only the electrons are heated by a single triangular pulse lasting 500 seconds and injecting 10 ergs per cubic centimeter into the loop plasma. The code used to make this figure can be found here.
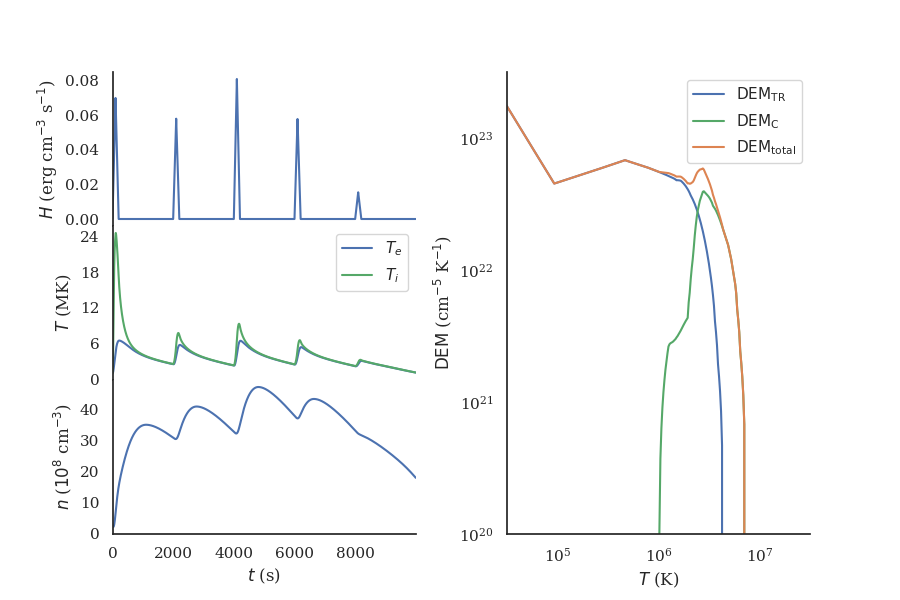
Ion Heating
In this second example, only the ions are heated. In this case, we heat the ions with five distinct pulses, each lasting 200 seconds and separated by about 2000 seconds. The energies are uniformly distributed between 0.001 and 0.1 ergs per cubic centimeter per second. The example code can be found here. Note how easy it is to programmatically generate the configurations for these different heating profiles.
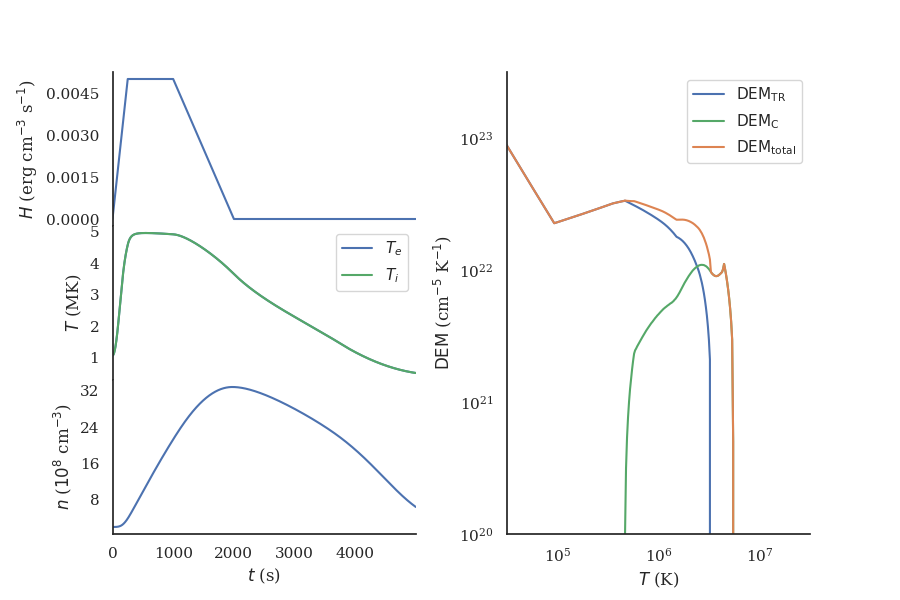
Single Fluid
Lastly, we show an example where the electron and ion populations are forced into equilibrium at all times, i.e. the single-fluid case. The loop plasma is heated by a single pulse lasting 2000 seconds that rises quickly (in 250 seconds), is sustained at 0.005 ergs per cubic centimeter per second for 750 seconds, and then decays back to the background value over 1000 seconds. The example code can be found here.